

The Internet is not information technology which was developed recently. It was already used at the time of World War II by the U.S. army. In the 50 years since the end of the war, it has become popularized. The reason for Internet penetration into the society may stem largely from the discovery of the practical use of the Internet, rather than the advancement of technology. People at the time of World War II would never have imagined that children could access all types of information by searching on the Internet as well as express their own thoughts on the blog, a personal writing space on the Internet. Even the capitalists at that time would never have imagined that the technologies developed for wartime use would lead to public dissemination and business opportunities. It was Bill Gates who, fifty years after the war, invented the operating system known as 'Windows', by using the graphical user interface (GUI). This development accelerated the growth of the use of personal computers in the home, thereby, leading to a rapid increase in the volume of Internet users.
The popularization of the Internet has caused a significant paradigm shift in a wide range of areas, in the same way as the invention of printing technology developed by Gutenberg ushered in the era of printing. In the days before the widespread of printing technology, only people of the privileged classes such as a clergyperson and a scholar were able to manipulate reading and writing (literacy) freely. However, the popularization of Gutenberg's printing technology enabled ordinary people to access such literacy. This led to an extensive paradigm shift in terms of overall cultural, economic, and social aspects of life. In a similar way, the popularization of the Internet enabled ordinary people to transmit and disclose information on the Internet at anytime anywhere that previously could have only been done by specialists. The paradigm shift inspired by diffusion of the Internet has brought us many advantages in the areas of culture, economy, and within society at all levels, however, at the same time it has triggered some very real problems. For example, prior to the widespread use of the Internet, children's fights were limited to directly bickering, scrimmaging, writing something bad about someone on paper or on a blackboard, etc., but never meant releasing someone's personal information to people around the world. Now, by means of the Internet it is possible to extend verbal bullying to a worldwide audience. Writing something bad about someone on a school blackboard is limited and considered prankish; however, writing something defamatory about someone on the electronic bulletin board is an entirely different matter. This type of disclosure of information enters into the realm of the invasion of privacy and can be categorized as a criminal offence and punished. Unfortunately, many children and even adults are unable to understand such a difference; therefore, this problem needs to be taken seriously.
In the title "Education for the Net Generation" of this report, the 'net generation' refers to the generation that have grown up in the period following the paradigm shift resulting from the diffusion of the Internet into society at large. To be more precise, the net generation includes the current generation already using the Internet and the next generation who were born into the world where the Internet is already popularized. In the past, reading, writing and the abacus were considered as the basics of education; however, in the current world of the post-paradigm shift, to be educated in the principles and use of information literacy is of equal significance. Information literacy differs from PC literacy, in that is requires the ability to read, understand and make a judgment about the information being accessed, as well as handling and utilizing the information to serve a specific purpose. For the 'Net Generation' it is imperative that they are educated in the subject of Information Literacy.
But to what degree does the young generation already have information literacy? There have been several surveys on the utilization rate of the Internet, accessing hours, contents for use, etc., but no large-scale international research on information literacy has been carried out. One of the well-known international research projects on 'Literacy' is the "Programme for International Student Assessment (PISA)" conducted by the Organization for Economic Co-operation and Development (OECD). This assessment is composed of three domains, namely, scientific, reading and mathematical literacy. When looking at every question in the framework of PISA conducted in 2006 regarding these three domains as the vertical axis, I have realized that, an element of information literacy as the horizontal axis factored into each of three domains. The following is a good example of a question in the scientific literacy domain that asks young students to choose suitable keywords for an Internet search.
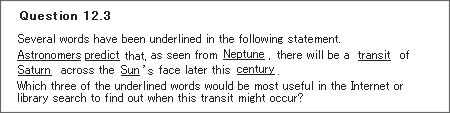
This question is to assess competency in the component of "Identifying scientific issues" in the framework. This proved very difficult for the students with only 13%, on average, answering correctly in English-language countries. This result demonstrates that the students' ability to identify scientific issues is quite low and untrained. In addition, they have not received enough education about information literacy to enable them to handle large volumes of data in order to reach the information they need. If they are given an option of using the Internet to solve scientific issues, they must know how to search and utilize the information appropriately and effectively. Therefore, education in information literacy is essential to the net generation.
In the domain of reading literacy, there is also an example of a question that requires the information literacy. The question asks young students to find out several pieces of information in the graphs and diagrams, and search for the answer to the question.
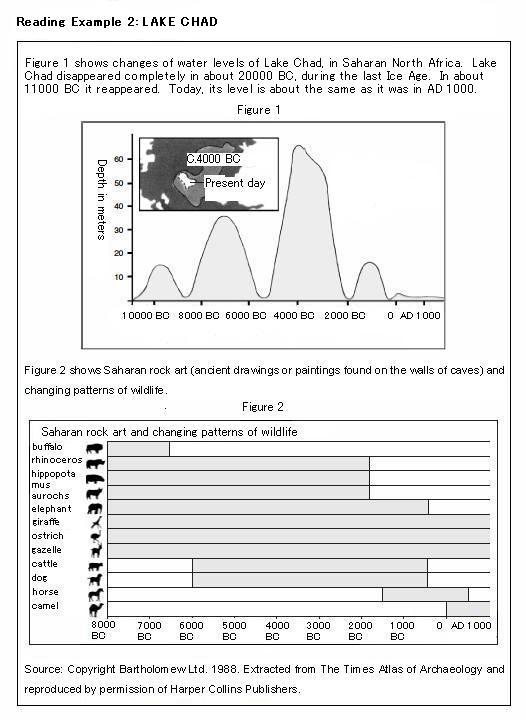
This task of interpretation requires students to compare information given in the line graph of figure 1 and the histogram of figure 2. They need to combine information from two different sources and identify a relationship between the changing water levels of Lake Chad over many years and the changing patterns of wildlife around and in Lake Chad. This question is designed to assess the students' ability to reach the answer by utilizing and analyzing the information in front of them, rather than drawing on their familiar knowledge from outside the text. If the student draws on such knowledge, he/she might choose the answer D "at the beginning of an uninterrupted dry period," however, if he/she gathers information from two sources given to him, the answer should only be "after the level of Lake Chad had been falling for over a thousand years." This is not the kind of question that requires the use of the Internet, but it is the type of question that can be used to asses the student's level of information literacy. The question tests whether a student can identify the relevant information from different sources and combine the information gathered to form a coherent answer. The ability to use information in this way is important in our modern society. We are continually bombarded with information from the Internet and other sources; therefore, the ability to deal competently with such a stream of information is vital.
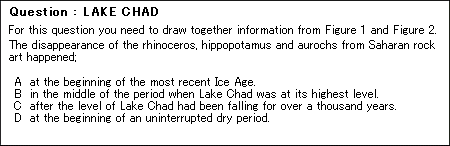
Furthermore, there is another question in the mathematical literacy domain that asks the students to read the information and consider how the information is presented. In the following question about crime in Zedland , alarm systems manufacturers produce a graph emphasizing an increased tendency for criminal offences, by intentionally skipping the data of 1980, so that the manufacturers can sell their alarm systems. On the other hand, the manufacturer who wants to show how successful crime fighting has been can present the graph to emphasize the tendency for a decrease in crime by using data only from 1980 to 1984. This proves that it is possible to present data in different ways, so that, in this case, crime can look as though it is 'increasing' or 'decreasing.' Therefore, it is very important to learn how to scrutinize a graph, analyze the data thoroughly, and then determine the credibility of information. The following question is a good sample of information literacy.
There is another question being asked to determine the credibility of information. The theme of this question is 'Think about the unemployment rate in Japan' and the data is given in the form of table. You are required to draw a conclusion of either a 'positive' or 'negative' opinion about the unemployment situation, depending on how the data are represented in the graph (Kanoh, 2002).
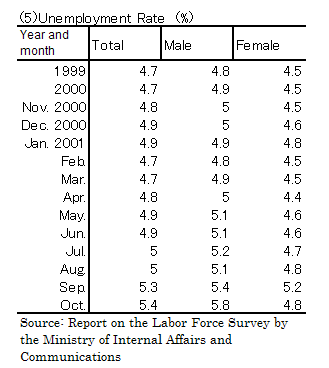
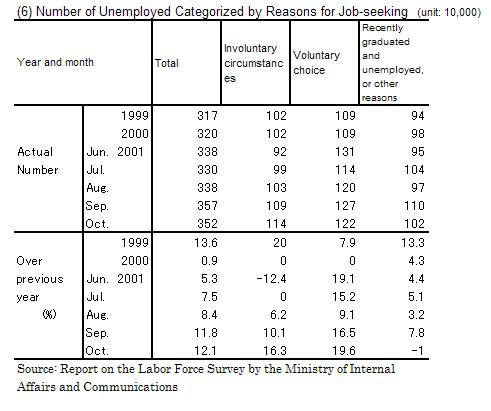
Tables: Unemployment Rate and Number of Unemployed Categorized by Reasons for Job-seeking
(Ministry of Internal Affairs and Communications in 2001, Cabinet Office in 2001)
Here, you are expected to propose a hypothesis on whether the unemployment condition in Japan is serious or not, by examining the two tables of unemployment rates and number of unemployed categorized by reasons for job-seeking, and then validate your hypothesis. The following two reports show how opposing conclusions were drawn from the respective data.
----<Quote from here>----
Presentation of Student A:
My hypothesis is that Japan's unemployment rate is not a serious matter. It seems to be increasing to some degree, but I think people are exaggerating. The government is now focusing on substantive employment measures by extending the period of unemployment benefit payments, subject to the recipient's attending job training, for the purpose of reemployment. This means that the unemployed people are now protected by law more than ever.
I have studied some materials published by the Ministry of Internal Affairs and Communications to make sure of the actual situation. Figure 3 shows changes in the unemployment rate. You can see some increase; but the degree is so minor that it will disappear immediately after the economy recovers. The unemployment rate reached its highest level in October 2001, with the highest point being 5.4%; a further increase is undesirable. Is it strange to think that if there are 100 people, 5 people or so may not want to get a job? Among the unemployed there will be a variety of people, some may be too fussy in their choice of employment, even though they are willing to work if eventually the right job becomes available. A person in this situation may continue to spoil himself by extending the moratorium period. So, I believe that because of several other factors at play, the rate is not too high and it can be considered within the allowable range.
(Note: This student seemed to misunderstand the meaning of unemployment rate, so I explained the definition then and there.)
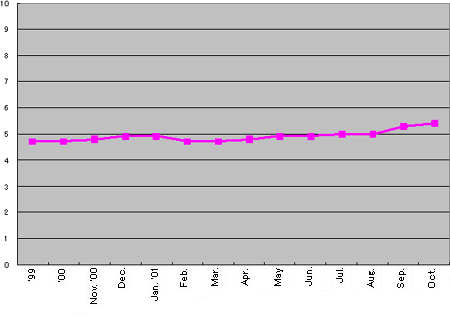
Figure 3: Unemployment Rate
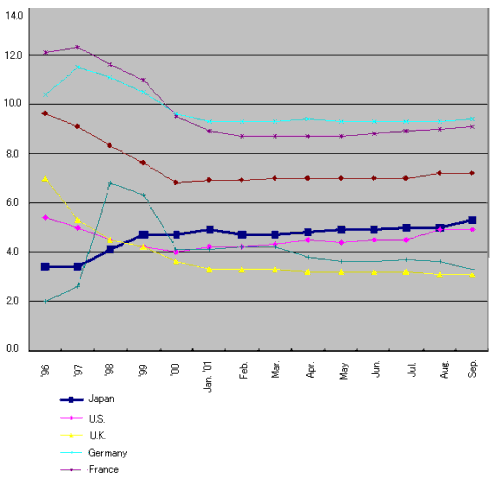
Figure 4: Cross-country Comparison of Unemployment Rate
In addition, I have examined whether Japan's unemployment rate is higher or lower than in other countries. Figure 4 shows the international comparison of the unemployment rate. From this graph, you can see the Japan's level is medium. Therefore, I believe the rate of 5.4% is at an acceptable level.
Presentation of Student B:
I have hypothesized that Japan's unemployment condition is serious. My friend told me the company for which her mother was working became a takeover target by a foreign company. As a result, although some people were employed by the new company take-over, the majority of people in this company lost their jobs including her mother. My friend's mother has given up hope of ever being employed again. I have heard of similar cases happening everywhere in Japan nowadays. Thus, I think the unemployment matter is a very serious social issue.
I have examined the reference data of the Ministry of Internal Affairs and Communications. Figure 5 shows the changes in the unemployment rate. Comparing the figures of 1996, 1997, and 1999, you can recognize an upsurge in the unemployment rate. Between 1999 and October, 2001, the unemployment rate has continued to increase year on year to a greater or lesser degree. If this phenomenon continues in future, it could really be a disaster. The total population of Japan stood at 127.2 million as of October, 2001, and the population of labor excluding children and the elderly was 67.57 millions. If the unemployment rate is 5.4%, the number of unemployed should be 6,868,800. Furthermore, according to the Ministry of Internal Affairs and Communications, the number of unemployed categorized by reasons of job-seeking, that is to say, the number of people who want to work but had no job stood at 3.52 million. It can be said that those 3.52 million unemployed people are certainly unfortunate; however, the working people are also unfortunate as they have to cover all of living costs of unemployed people somehow, therefore everybody suffers in some way.
When drawing my graph of the unemployment rate, I have used a little of my ingenuity to emphasize the gap in the figures before and after 1999. I noticed the unemployment rate in 1999 reached a record high of 13.6% in the table showing the number of unemployed categorized by reasons of job-seeking published by the Ministry of Internal Affairs and Communications. Since this table does not contain any data before 1999, I chose the data between 1996 and 1999 from the graph of international unemployment comparison (Japan's part), then combined them together to draw one graph. If I used the data only from 1999, I could not have shown you the notable increase since 1999. By combining all data from 1996 to 2001, I have succeeded in showing impressively the sudden increase in the unemployment rate at the point of 1999.
Figure 6 shows the international comparison of unemployment rates. I thought it is difficult to compare simply the figure for each country because of different factors such as tradition, culture, etc. Therefore, I compared the variance of data between September in 1996 and September in 2001 of each country.
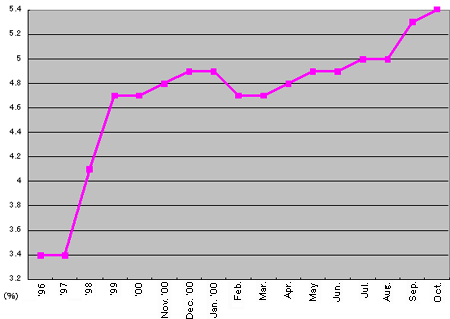
Figure 5: Unemployment rate
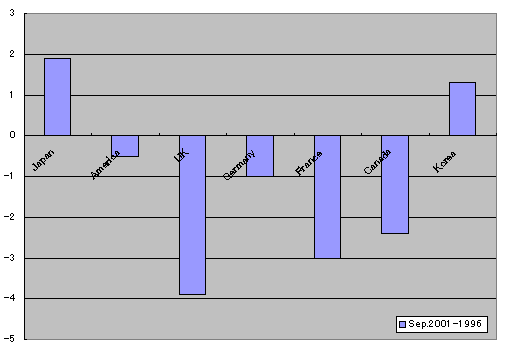
Figure 6: International Comparison of Unemployment Rate
In this way, I compared the movement trend of unemployment rates by each country, instead of comparing the unemployment rate at a certain point of time in each country. As a result, it became obvious that Japan has the highest rate of increase compared to other countries. I really regret that Japan has proved to have the worst rates of increase in the area of unemployment.
----<Unquote here>----
As described above, you can see how the data is converted into a graph in different ways. It all depends on the designer's subjective reaction, intention, and subconscious influences stemming from his/her hypothesis. Therefore, a conclusion can be very different, maybe perfectly opposite, drawn from the same data; because it depends on the way the person interprets such data. To understand this kind of distortion, the subject of information literacy should be acquired by everybody who lives in a world where we are continually bombarded with information. Unfortunately, there are still many people without such literacy, and there seems to be no end to those victims who are cheated by the graphs, which a salesman may offer, which in turn leads to people being swindled.
<Reference cited>
"Establishing the Information Department with the Portfolio: New Teaching Practice and Evaluation Method" Hiroko Kanoh, Kitaoji Publishing (2002)
<Website cited>
Japanese translation of "Assessing Scientific, Reading and Mathematical Literacy: A Framework for PISA 2006 conducted by OECD" National Institute for Educational Policy Research,
http://www.pisa.oecd.org/dataoecd/13/57/39116722.pdf