

Introduction
Technology is an important part of our lives with the expectation for technology to be in instruction (Yurtseven Avci et al., 2020). Budinski and Milinkovic (2017) explain that technology is increasing in mathematics instruction. In education, technology is used to improve student learning (Kurvinen et al., 2020). The integration of technology into math instruction has a positive impact on student performance and achievement, a significant impact in some cases. For example, in a study by Liu (2013) in a predominantly Black school district, it was found that when using Flash and Dreamweaver in math lessons, both teachers and students reported positive perceptions, with most reporting they really enjoyed the lesson.
Calder (2018) conducted a study with 10-year-old students using Scratch. Scratch is a programming application that implements a building block format in order to manipulate media. Calder found that students improved problem-solving skills, engaged in communication and collaboration, and developed computational thinking. A study investigating the use of multimedia with diverse learners, including those with learning disabilities (LD) revealed that the students improve in mathematics performance (Kaczorowski et al., 2019).
Research continues to show that students in the US are falling behind in mathematics (NCES, 2011; NMAP, 2008). Organization for Economic Co-operation and Development (OECD) data on the Program for International Assessment (PISA) for mathematics in 2022 reported that the average scores in mathematics were lower than in 2018 and were among the lowest ever measured by PISA. Although students in the United States did score close to the OECD average, they were still below the average. The United States only had 7% of students scoring in the top two levels on PISA, compared to countries like Singapore with 41%, Chinese Taipei with 32%, and Macao (China) with 29%.
According to the OECD data, the average score in mathematics in the United States was 465, compared to the OECD average of 480, continuing to show the lower mathematics performance in the United States (OECD, 2023). Data suggests that more needs to be done to increase student math scores including the use of technology, such as Prodigy Math. Prodigy Math is a game-based website in which teachers can create assignments on specific math concepts and skills for students to practice aligned with Common Core Math Standards (Prodigy, 2023). The intent of the study was to determine whether Prodigy Math is an effective resource in helping students improve math skills. Prodigy Math was chosen, as it is a resource the author implements in the classroom. Students appear engaged when working on math educational games (Johns Hopkins University, 2020).
Math Educational Game
Perceptions of and Student Engagement with Math Educational Game
Several studies have investigated student and teacher perceptions of math educational games (Johns Hopkins University, 2020; Lyons, 2020; White, n.d.; Zmuda, n.d.). For example, Johns Hopkins University (2020) found that educators had a very positive view of math educational games and stated that student engagement was one of the biggest strengths of the game. The researchers reported that students of all abilities, including special education and English Language Learners (ELL) students remained engaged with math educational game. Muhammad (n.d.) reported that students were more engaged in math when using math educational games due to increased confidence in math. However, Lyons (2020) found different results in her study, that students actually had a more negative attitude toward using math educational games both inside and outside of the classroom at the end of the study than they did at the beginning of the study. Lyons hypothesized that this may be due to some students not being as motivated to use Prodigy as other students were. In addition, Lyons explained that students may have been taking their learning home to their families and were becoming more confident in asking family members for help, as opposed to getting on Prodigy.
Effects of Math Educational Game on Math Performance
Studies reported whether math educational game affected student performance (Bak, n.d.; Johns Hopkins University, 2020; Lyons, 2020; Puckett, n.d.; Zmuda, n.d.). As Bak (n.d.) describes, during the 2019-2020 school year, students in the Fullerton School District (California, USA) learned an average of 11 new math skills per month while they were using the math educational game. Johns Hopkins University (2020) found that the use of math educational game had a statistically significant gain of 0.00113 points on assessment scores for each question a student answered on math educational game, while each correct answer resulted in an increase of 0.00160 points. Lyons (2020) reported that math educational game, overall, helped students increase performance on decimals and skills with fractions, especially when used in conjunction with individual interventions. Further, Puckett (n.d.) reported that some students were able to grow two to three grade levels in less than a year by using math educational game. According to the report by White (n.d.), fourth-grade students improved by more than half a grade level between two placement tests by using math educational game at least 40 minutes each week. Zmuda (n.d.) also found that students who regularly used math educational game during the 2019-2020 school year mastered almost double the number of math skills that they did the previous year. In general, the data supports that math educational game use increases math achievement.
The Study
Purpose and Research Questions
This study had three purposes. The first purpose was to investigate if using a math educational game (Prodigy©) improved overall students' mathematics skills and concepts.*1 The second purpose was to find out if using math equational game improve success in math skills and concepts in subgroups of special education, different ethnicities, and different genders. The third purpose was to investigate students' perceptions of math educational game and their success in mathematics. Two units of study in fifth grade mathematics were included; unit one was on multiplying of whole numbers, unit two was on dividing of whole numbers.
In unit one, participants received traditional instruction and used Prodigy math educational game, while in unit two they only received the traditional instruction. By conducting this study, the researcher hoped to investigate if the use of math educational game improved participants' success in fifth grade mathematics.
The study was guided by three research questions. The questions are as follows:
- Does the math educational game improve student success in mathematics?
- Does the math educational game improve, specifically, the success of special education students, students of different ethnicities, and different genders in mathematics?
- What are students' perceptions of math educational game and their success in mathematics?
Approach and Design A quantitative approach (Mertler, 2023) with a causal-comparative design [ex post facto] (Creswell & Creswell, 2018) were used for the study. The study included two fifth grade mathematics units; the first unit was on multiplying whole numbers (multiplying two- and three-digit numbers by two-digit numbers). The second unit was on dividing whole numbers (dividing two-, three-, and four-digit dividends by two-digit divisors). In the first unit, participants used the math educational program, while in the second unit, they did not. In the first unit, the Multiplying Whole Numbers pre- and post-test were used.
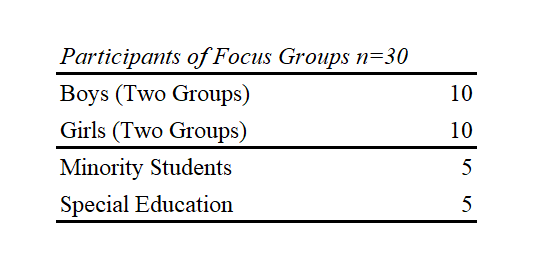
In the second unit, the Dividing Whole Numbers pre- and post-test were used. Results were then compared between the performance of participants in the two units to find out if math educational game is helping participants' success in learning mathematics. The focus group interviews were conducted in groups of five at the conclusion of the second unit (see Table 2). One participant was not included in the focus group interviews due to being absent the day of the interviews.
Sample
The study consisted of 31 fifth-grade students. See Table 1 below.
Table 1
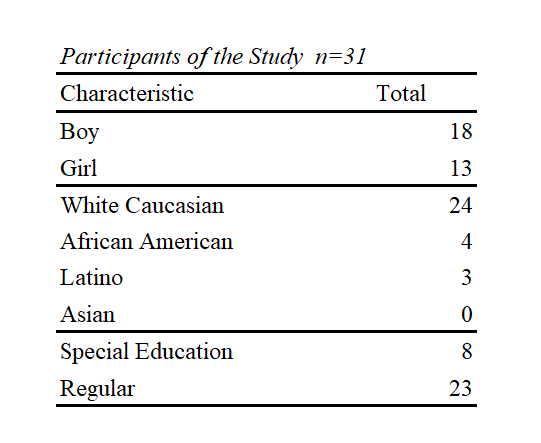
Table 2
Instrument and Data Analysis
Three instruments were used to collect data:
- Two pre-tests and post-tests, with one of each being on multiplying and the others on dividing. There were 15 questions for Unit 1 on multiplying and 15 questions for Unit 2 on division. Questions included general problems as well as word problems.
- A survey to get data on participant perceptions of math educational game and their abilities as mathematicians. Statements asked participants whether they felt that math educational game helped them practice math, if they liked math educational game, if they were more confident in math with math educational games, whether teachers and students should use math educational game, and if they enjoyed math more because they were able to use math educational game.
- A focus group interviews with sub-groups of participants. These questions focused on what participants thought about playing math educational game, whether it made math easier and more fun, what they liked about Prodigy, and if they would recommend it for participants in other classrooms. Data from pre- and post-tests was analyzed quantitively using central tendency.
Data from survey and focus group interviews was analyzed qualitatively to find themes of the study.
Results
Research Question 1: Does the Math Educational Game Program Improve Student Success in Mathematics? To answer this question, pre- and post-test data for the two units, the first on multiplying whole numbers and the second on dividing whole numbers, were used to answer the question. In the first unit, participants were allowed to use math educational game.
Pre-Tests and Post-Tests
The results for the pre-tests and post-tests show the overall mean increased from 2.677 (SD=2.880) on the pre-test to 9.581 (SD=4.048) on the post-test for the whole group. In the second unit, participants were not able to use math educational game for extra practice. The mean increased from 0.710 (SD=1.657) on the pre-test to 5.419 (SD=3.871) on the post-test for the whole group. Participants showed a greater mean score increase with Prodigy than without math educational game. This data would indicate that, for the whole group, math educational game appears to improve students' performance in mathematics. See Table 3.
Research Question 2: Does the Math Educational Game Program Improve, Specifically, the Success of Special Education Students, Students of Different Ethnicities, and Students of Different Genders in Mathematics?
Special Education
Eight participants were included in the special education sub-group, and 23 participants in the non-special education group. The results for the unit one pre-test and post-test are shown in the Table 3. The mean score of the special education subgroup increased from 1.000 (SD=1.604) on the pre-test to 6.625 (SD=5.208) on the post-test. In the non-special education subgroup, the mean increased from 3.261 (SD=3.018) on the pre-test to 10.609 (SD=3.071) on the post-test.
Ethnicity
In ethnicity group, 24 participants in the White subgroup, four participants in the African American subgroup, and three participants in the Latino subgroup were included. The results for the unit one pre-test and post-test are shown in Table 4. The mean performance of the White subgroup increased from 3.125 (SD=3.026) on the pre-test to 10.375 (SD=3.308) on the post-test. In the African American subgroup, the mean increased from 0.750 (SD=1.500) on the pre-test to 5.750 (SD=5.123) on the post-test. The Latino subgroup showed an increase in the mean from 1.667 (SD=2.082) on the pre-test to 8.333 (SD=6.429) on the post-test.
Gender
Eighteen participants were included in the male subgroup and 13 participants in the female group. The results for the unit one pre-test and post-test are shown in the table below. The mean performance of the male subgroup increased from 2.833 (SD=2.813) on the pre-test to 9.667 (SD=4.102) on the post-test. In the female subgroup, the mean increased from 2.462 (SD=3.072) on the pre-test to 9.462 (SD=4.134) on the post-test. In unit two, the mean performance of the male subgroup increased from 0.944 (SD=2.014) on the pre-test to 5.833 (SD=3.365) on the post-test. In the female subgroup, the mean increased from 0.385 (SD=0.961) on the pre-test to 4.846 (SD=4.562) on the post-test. Both males and females showed a greater mean score increase with math educational game than without the math educational game. This data would indicate that, for both genders, math educational game appears to improve students' performance in mathematics.
Research Question 3: What Are Students' Perceptions of the Math Educational Game Program and Their Success in Mathematics? Results for this question were based on the survey and focus group interviews. The survey was analyzed based on the whole group as well as subgroups based on special education versus non-special education, ethnicity, and gender.
Whole GroupThe results of the survey were first compiled and analyzed based on the whole group. The results are shown in Table 3 below. Table 3
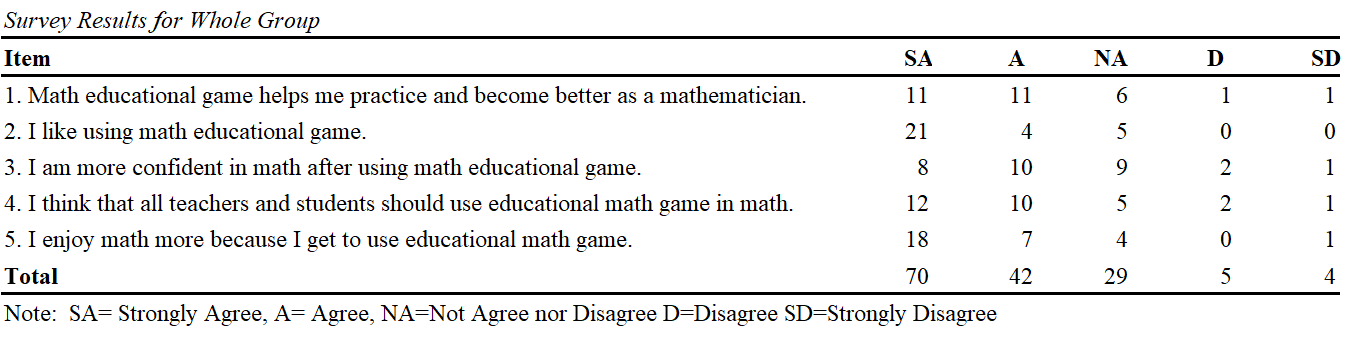
The participants overwhelmingly answered strongly agree or agree to the statements. Taking all the responses together, only nine participant responses were disagree or strongly disagree for any of the statements. Looking at the individual statements, participants overwhelmingly believed that math educational game helps them practice and become better as mathematicians, with 22 participants, either agreeing or strongly agreeing with the statement, and only eight participants not agreeing or disagreeing, disagreeing, or strongly disagreeing. The vast majority of participants also enjoy using math educational game, with 25 participants reporting that they like using math educational game and the other five participants neither agreeing or disagreeing; no participants disagreed with that statement.
The third statement of the survey had the most spread of responses of the statements, with the majority agreeing with the statement but just over one-third (12) responding in the other three categories, the highest number of those responses for any of the statements in the survey, and the statement that had the lowest number of participants who strongly agreed with the statement, with only eight participants responding that way. The majority of participants, 22, agreed or strongly agreed that all students and teachers should use math educational game in math. Interestingly, the participant who strongly disagreed with the statement agreed with many of the other statements. Overall, participants responded that they enjoyed math more because they were able to use math educational game, with only one participant disagreeing with the statement, compared to 25 who agreed or strongly disagreed. Overall, participants had an extremely positive view of math educational game.
Special Education Versus Non-Special Education
The survey data was also disaggregated and analyzed based on whether participants receive special education services. The results are provided in Table 4.
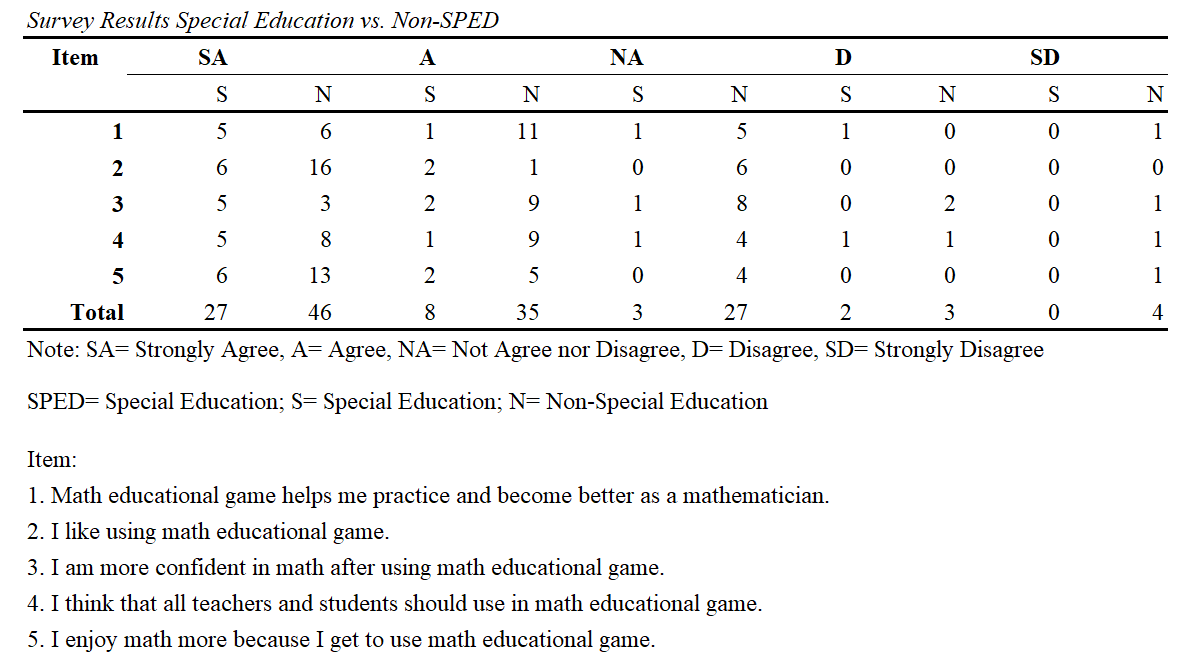
Both the special education and non-special education groups had their highest totals of responses in the strongly agree category, with 27 and 46 responses, respectively. However, looking at the data, overall, special education participants had a more favorable overall attitude toward math educational game, with 87.5% of the total responses in the strongly agree or agree categories. In contrast, only 70.4% of the non-special education participants' responses were in these two categories. In addition, the non-special education group had four responses in the strongly disagree category, while no special education participants indicated they strongly disagreed with any of the statements.
Ethnicity
The survey results were broken down into three ethnicities: White, African American, and Latino. These results were then analyzed. The data is provided below in Table 5.
As with the special education versus non-special education analysis, the highest number of total responses for all three groups, White, African American, and Latino, were all in the strongly agree category, with 45, 12, and 13, respectively. The larger differences in numbers between the ethnicities is due to the demographics of the participants, with White being the predominant ethnicity of the group. As the data also shows, participants in the White subgroup were more likely to disagree with statements in the survey. There were only two disagree responses from the African American subgroup with no strongly disagree responses.
For the Latino subgroup, there were no disagree or strongly disagree responses. However, even with the predominantly White composition of the group, there will still only seven disagree or strongly disagree responses. This data would demonstrate that the vast majority of participants, no matter the ethnicity, have a more positive view of math educational game. Out of the total responses, 74.7% were either in the strongly agree or agree categories, while only 19.3%, just over three percent, and just under two percent were in the neither agree nor disagree, disagree, and strongly disagree categories, respectively. This also demonstrates that 84% of the total responses were not on the negative side of the spectrum.
Table 5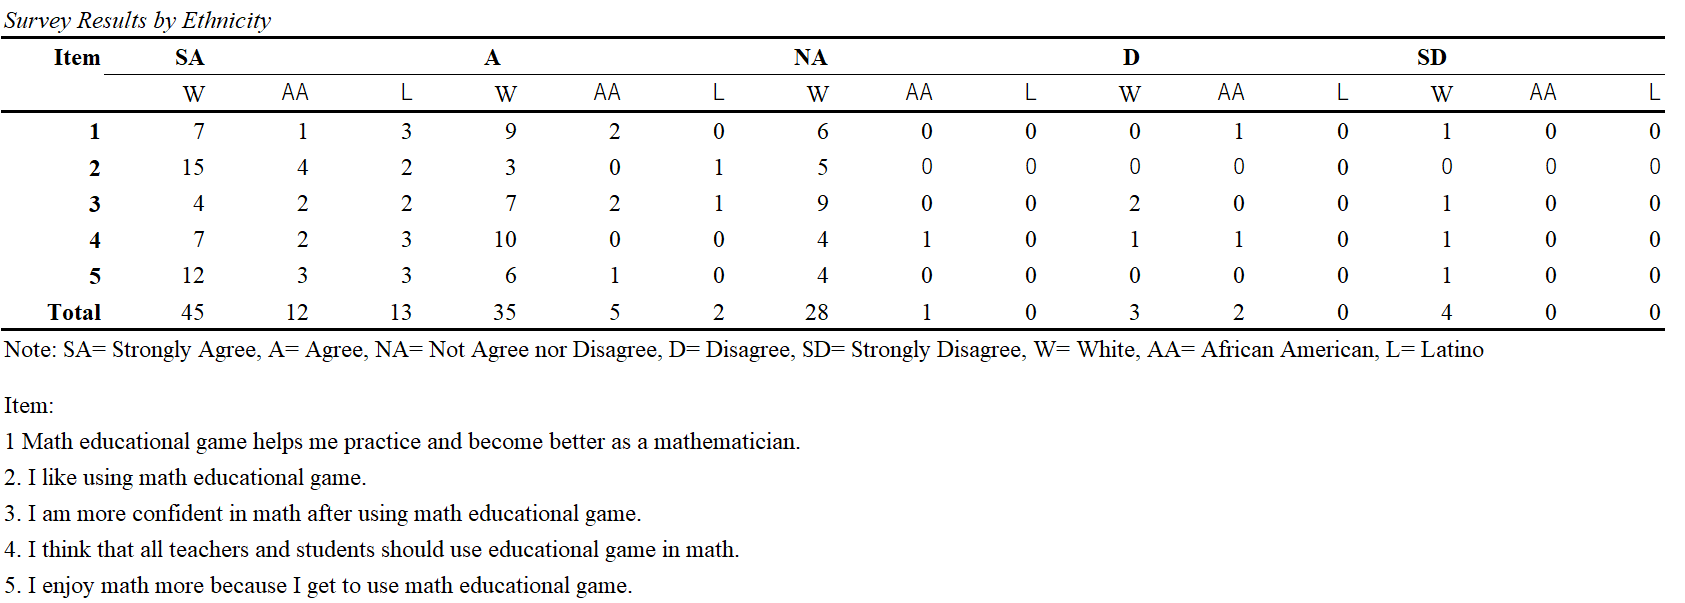
Gender
Survey results were then organized and analyzed based on gender. The results are organized below and data is shown in Table 6.
In many cases, the responses of males and females to the statements are similar. For example, when looking at the first statement about whether the participants believe that math educational game helps them practice and become better as a mathematician, six males each answered strongly agree and agree, while five females each answered strongly agree and agree. Three males and three females responded neither agree nor disagree.
For the second statement, more males than females responded that they strongly agreed with the statement. For the third statement, the response choices for both males and females are similar. The response rates for each choice are within two of each other. Males and females both had similar strongly agree and agree responses to the fourth statement. For the final statement, the largest difference came in the strongly agree category, with twice as many males answering that way than females.
Overall, both males and females had positive feelings toward math educational game. Males had a total of 64 strongly agree or agree responses. This is compared to 21 responses in the other categories. Females had a total of 48 strongly agree or agree responses. On the other hand, females only had 17 total responses in the other three categories, with none in the strongly disagree category.
Table 6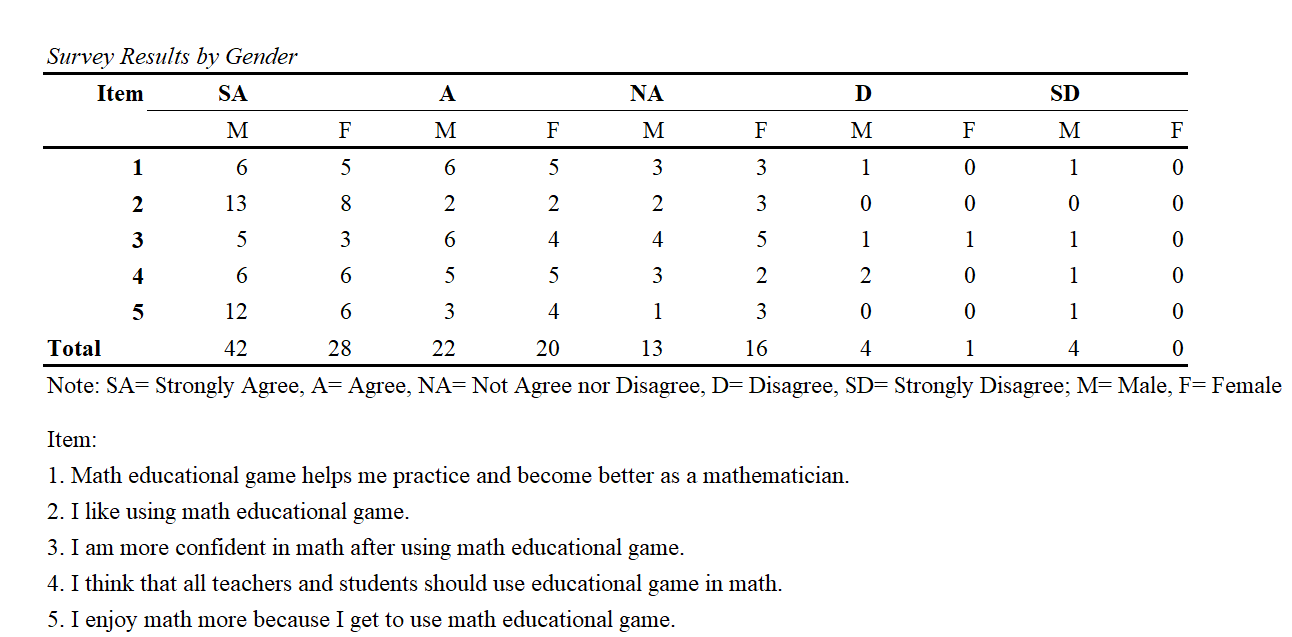
Focus Group Interviews
Whole Group: Overall, participants shared positive views of math educational game, especially by the end of the study. Nearly all participants shared they thought math educational game was fun and they liked it at the end of the study. The majority of the participants thought that math educational game made learning math easier and more fun, although many focused on the non-math aspects. When asked about the most and least favorite parts of math educational game, many also focused on the non-math aspects. Participants shared various amounts of time that they used math educational game on average each week and were varied in whether they thought their amount of time was too much, too little, or just right.
Special Education: Special education participants shared an overall positive view of Prodigy from the beginning and at the end, saying that it helped them with math and got to learn something new. Only one participant shared a negative first impression but also shared liking it at the end of the study. However, the participants said math educational game made math more fun. When asked about their favorite and least favorite parts of math educational game, many mentioned non-math aspects as their favorite, while many of them included math in their response for their least favorite part. All participants shared being on math educational game at least three times a week but were not unanimous in whether their amount of time spent was too much, too little, or just right. Most participants said that teachers and students should use the educational game in math.
Minority: Minority participants also shared an overall view of math educational game from the first time they saw it until the end of the study. One did share being unsure of math educational game at first. However, by the end that participant had a positive view. Only one reported not playing much at the end of the study. The participants reported that math educational game made math easier and more fun, although they were split on the reasons why. When asked about their favorite and least favorite parts of math educational game, several of the participants shared non-math aspects for both questions, although three did refer to math-related aspects in their response to the least favorite part question. All participants reported playing math educational game at least three times a week but were not consistent in whether they felt the time was the right amount, too little, or too much. Nearly all participants felt that students and teachers should be using math educational game.
Girls and Boys: Many participants in both of the boys' groups and both of the girls' groups felt that the math educational game was weird, boring, hard, and scary at the beginning. However, many more had a positive view by the end of the study. Many of the participants in both groups felt that math educational game made math easier and more fun. However, several of the girls reported that the math educational game was less fun at the end of the study than it was at the beginning of the year, sharing that making it a required activity made it less fun. When asked about their favorite part, the girls were split on math and non-math aspects, while the boys mainly focused on non-math aspects, including avatar customization. When asked about their least favorite parts, nearly all participants in both groups focused on non-math aspects, including battling and needing a membership for extra perks. All the girls who were on math educational game at least three times a week reported they felt it was too much time. However, the other girls and all the boys had varied responses to the amount of time and whether it was the right amount. When asked whether teachers and students should use math educational game, all the girls in one group answered yes, while the other girls' group unanimously stated that they "should do what they want to do." All the boy participants, except one, answered yes.
Finding and Conclusion
The results from the pre-tests and post-tests show that math educational game has a positive impact on student achievement, both in overall results as well as in subgroups based on special education versus non-special education, students of different ethnicities, and students of different genders. Participants increased the mean score 6.904 points from 2.677 to 9.581 in the unit where they could use math educational game as compared to only raising their mean score 4.709 points from 0.710 to 5.419 in the unit in which they were not able to use math educational game. See Table 7 scores of mean and standard deviations of math educational game versus no math educational game based on whole group and subgroups.
Table 7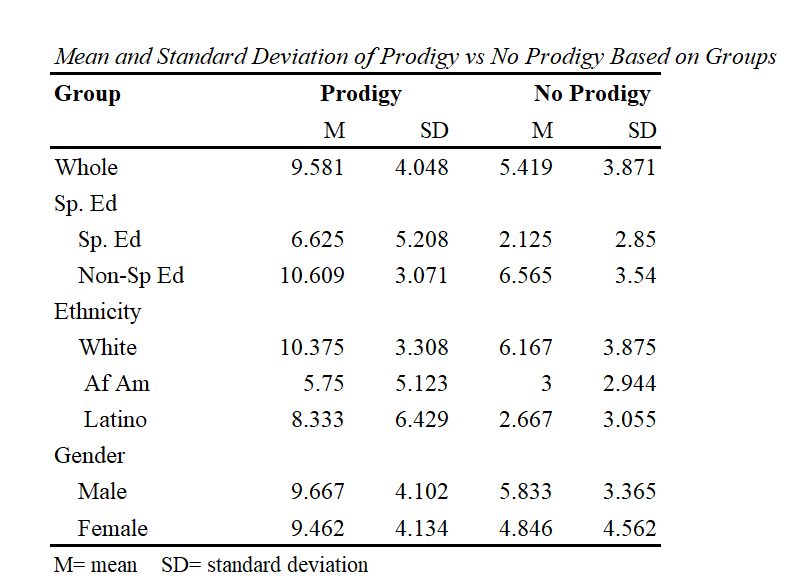
Similar results were observed when analyzing based on different subgroups. Special education participants saw a larger increase in their mean score in the unit with the math educational game than in the unit without math educational game. The non-special education subgroup demonstrated a comparable result. All three ethnicities showed identical trends. For the White, African American, and Latino subgroups, all three saw a higher increase in mean scores in the unit with math educational game compared to the unit without math educational game. Matching results could be observed when looking at gender. Both the male and female subgroups had a higher mean increase in the unit with math educational game than in the unit with no math educational game.
The results from this study shows that most students are engaged with and motivated to get on the math education game activities. Using these math games could provide a better choice for teachers to teach math using an effective and appropriate technology for elementary school students.
- *1 Prodigy Math is a game-based online math program that allows students to practice skills related to math based on curriculum standards. Educators can create assignments based on specific skills as well as get reports on student performance. It was developed by Peters and Mahimker in 2011.
-
References
- Bak, C. (n.d.). How Fullerton School District students master more math skills every month. Prodigy. https://www.prodigygame.com/main-en/prodigy-math-research-fullerton-california/
- Budinski, N., & Milinokovic, D. (2017). Transition from realistic to real world problems with the use of technology in elementary mathematical education. Acta Didactica Napocensia, 10(1), 53-61.
- Calder, N. (2018). Using Scratch to facilitate mathematical thinking. Waikato Journal of Education, 23(2). https://doi.org/10.15663/wje.v23i2.654
- Johns Hopkins University (2020). Evaluation of Prodigy: Key findings. https://prodigy-website.cdn.prismic.io/prodigy-website/9ee58b31-3537-42c3-9eff-f8e6b16db030_Prodigy-Evaluation-Key-Findings_Final.pdf
- Kaczorowski, T., Hashey, A., & Marco Di Cesare, D. (2019). An Exploration of Multimedia Supports for Diverse Learners During Core Math Instruction. Journal of Special Education Technology, 34(1), 41-54. https://doi.org/10.1177/0162643418781298
- Kurvinen, E., Kaila, E., Laakso, M.J., & Salakoski, T. (2020). Long Term Effects on Technology Enhanced Learning: The Use of Weekly Digital Lessons in Mathematics. Informatics in Education, 19(1), 51-75. https://doi.org/10.15388/infedu.2020.04
- Liu, Y. (2013). A comparative study of integrating multimedia into the third grade math curriculum to improve math learning. Journal of Computers in Math and Science Teaching, 32(3), 321-336.
- Lyons, C. (2020). Identifying Opportunities and Challenges of Using Prodigy Math in a Sixth Grade Math Classroom [Unpublished master's thesis]. St. Catherine University. https://cdm17519.contentdm.oclc.org/digital/collection/maed/id/116/rec/3
- Mertler, C. A. (2023). Introduction to Educational Research, 3rd Ed. SAGE.
- Muhammad, V. (n.d.). How Prodigy's easy-to-use platform helped promote math confidence. Prodigy. https://www.prodigygame.com/main-en/prodigy-math-research-clayton-county-georgia/
- NCES (2011). The Condition of Education 2011. US Department Education. https://nces.ed.gov/pubsearch/pubsinfo.asp?pubid=2011033
- NMAP (2008). Foundations for Success: The Final Report of the National Mathematics Advisory Panel. US Department of Education. https://eric.ed.gov/?id=ED500486
- OECD (2023). PISA 2022 Results. https://www.oecd.org/content/dam/oecd/en/publications/reports/2023/11/pisa-2022-results-volume-i-and-ii-country-notes_2fca04b9/united-states_243107b0/a78ba65a-en.pdf
- Prodigy (2023). Prodigy Math. https://www.prodigygame.com/main-en/prodigy-math/
- Puckett, S. (n.d.). How using Prodigy helped bridge learning gaps. Prodigy. https://www.prodigygame.com/main-en/prodigy-math-research-haralson-county-georgia/
- White, J. (n.d.). How Prodigy increased motivation and student performance in Floyd County. Prodigy. https://www.prodigygame.com/main-en/prodigy-math-research-floyd-county-georgia/
- Yurtseven Avci, Z., O'Dwyer, L. M., & Lawson, J. (2020). Designing effective professional development for technology integration in schools. Journal of Computer Assisted Learning, 36(2), 160-177.
- Zmuda, E. (n.d.). How Clifton Public Schools engages diverse learners with Prodigy Math game. Prodigy. https://www.prodigygame.com/main-en/prodigy-math-research-clifton-new-jersey/
 Justin Bledsaw
 Sham'ah Md-Yunus