| To better grasp the situation of ECEC around the world, it is essential to understand the circumstances in each country. In this section, we introduce basic information ranging from population size and educational investment in the country to educational systems, mainly focusing on the preschool phase. It is our humble hope that this information will be of some use to our readers who are interested in ECEC around the world. |
Updated on August 21, 2015
1. Capital: Oslo
2. Population: 5 143 000 (2015)
3. Official/National Language(s): Norwegian (Bokmål and Nynorsk)
4. Currency: Norwegian krone (NOK)
5. System of Education and Childcare
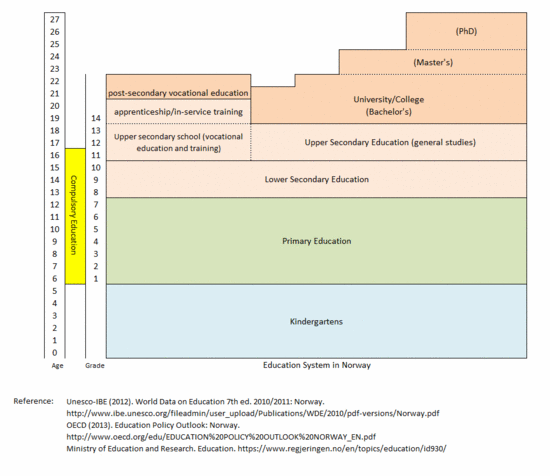
- Education system: Kindergarten (ages 0-5), primary (ages 6-12), lower secondary (ages 13-15), upper secondary (ages 16-18), tertiary (age 19-)
- Regulating authority: Ministry of Education and Research (Since 2006, all ECEC facilities are regulated by the Ministry of Education and Research.)
- Compulsory education: Ages 6-16
- 3 year old: 95% (2012)
- 4 year old: 97% (2012)
- 5 year old: 97% (2012)
- 6 year old: 100% (2012)
- Pre-primary: 0.5% (2011)
- Primary, secondary, and post-secondary non-tertiary: 5.3% (2011)
- All levels of education combined: 8.7% (2011)
- Primary: N/A
- Pre-primary: N/A
- Primary: 10 (2012)
- PISA 2012: Math-30, Reading-22, Science-31
- TIMSS 2011 (4th grade): Math-29, Science-33

-
Reference
- 2. Population Division, United Nations. World Population Prospects: The 2012 Revision.
http://esa.un.org/unpd/wpp/unpp/panel_population.htm. - 5. Unesco-IBE (2012). World Data on Education 7th ed. 2010/2011: Norway.
http://www.ibe.unesco.org/fileadmin/user_upload/Publications/WDE/2010/pdf-versions/Norway.pdf - OECD (2013). Education Policy Outlook: Norway.
http://www.oecd.org/edu/EDUCATION%20POLICY%20OUTLOOK%20NORWAY_EN.pdf - Ministry of Education and Research. Education.
https://www.regjeringen.no/en/topics/education/id930/ - 6. OECD (2014). Education at a Glance 2014: OECD Indicators, OECD Publishing.
http://dx.doi.org/10.1787/eag-2014-en. Table C2.1 Enrolment rates in early childhood and primary education, by age (2005, 2012). http://dx.doi.org/10.1787/888933118333. - 7. OECD (2014). Education at a Glance 2014: OECD Indicators, OECD Publishing.
http://dx.doi.org/10.1787/eag-2014-en. Table B4.1. Total public expenditure on education (2011). http://dx.doi.org/10.1787/888933117573. - 8. OECD (2014). Education at a Glance 2014: OECD Indicators, OECD Publishing.
http://dx.doi.org/10.1787/eag-2014-en. Table D2.1. Average class size, by type of institution and level of education (2012). http://dx.doi.org/10.1787/888933119682. - 9. OECD (2014). Education at a Glance 2014: OECD Indicators, OECD Publishing.
http://dx.doi.org/10.1787/eag-2014-en. Table D2.2. Ratio of students to teaching staff in educational institutions (2012). http://dx.doi.org/10.1787/888933119682. - 10. OECD (2013). PISA 2012 RESULTS IN FOCUS. Snapshot of performance in mathematics, reading and science. http://www.oecd.org/pisa/keyfindings/pisa-2012-results-snapshot-volume-I-ENG.pdf.
- Martin, M.O., Mullis, I.V.S., Foy, P., & Arora, A. (2012).The TIMSS 2011 International Results in Mathematics. Chestnut Hill, MA: TIMSS & PIRLS International Study Center, Boston College. http://timssandpirls.bc.edu/timss2011/downloads/T11_IR_M_Chapter1.pdf, p.40.
- Martin, M.O., Mullis, I.V.S., Foy, P., & Stanco, G.M. (2012). The TIMSS 2011 International Results in Science. Chestnut Hill, MA: TIMSS & PIRLS International Study Center, Boston College. http://timss.bc.edu/timss2011/downloads/T11_IR_S_Chapter1.pdf, p.38.


