|
Effects of Declining Birthrate on Low Birth Weight Incidence Rate in South Korea
Jung Han Park, M.D., M.P.H., Dr.Ph., Professor of Preventive Medicine, Catholic University of Daegu School of Medicine, Korea
Konnichiwa. I am Professor Jung Han Park. It is a great honor for me to participate in this significant international symposium as a panelist. I thank Dr. Kobayashi and his staff of CRN for inviting me to this wonderful symposium.
I. Dramatical decline of total fertility rate in Korea
The total fertility rate, TFR, of Korea declined dramatically in 1960s and 1970s due to rapid industrialization and the strong family planning program of the government. It had dropped from 6.0 in 1960 to 4.53 in 1970 and to 2.83 in 1980. Thereafter it remained around 1.6 from 1985 through 1995. But it started to decline again from 2000 and marked 1.08 in 2005, which is the lowest TFR record in the world except in a few city-states. There are two important direct causes for this dramatic decline of the fertility rate. <Figure 1>
One is the postponement of marriage by men and women so that the average age at first marriage increased. <Figure 2>
The second cause is the decline of the birth rate after marriage. Particularly, in the 20-age group, the fertility rate declined drastically among people in their early 20s. Interestingly, the birth rate in the 30-age group, however, has slightly increased. Because of these kinds of changes, the maternal age and the parity distribution of all births has changed very significantly. For instance, in 1995, the babies born to women in the 20-age group accounted for about three quarters of all births. But that proportion had declined to a little less than 50 percent in 2005. On the other hand, the babies born to women of the 30-age group had increased from 25 percent to 50 percent. <Figure 3>
Page Top
II. Factors of increase of low birthweight incidence
At the same time we have observed a steady increase of low birthweight incidence. It increased from 3 percent in 1995 to 4.3 percent in 2005. At the same time, we also observed an increasing trend in the multiple pregnancy rate. It increased from 1.3 percent to 2.2 percent in the same period. <Figure 4>
Birthweight is a very sensitive indicator of the health of newborns. The neonatal mortality rate of a baby born with a low birthweight under 2500 grams is about 20 times higher than that of a baby born with a body weight of 2500 grams and over. And also even if they survive, they have a high incidence rate of neurologic sequelae such as mental retardation.
Birthweight is related to many factors. I have developed a theoretical framework regarding how different factors play a role in increasing low birthweight incidence. <Figure 5>
The first factor is maternal age and parity. Due to the change in the social, economic and cultural environment, young people delay marriage and they do not conceive as often; and therefore maternal age goes up and parity goes down, which means a decline in birthweight. Higher age itself is a high risk for a low birthweight baby. And when men and women age, the physiologic capacity of reproduction, in other words, fecundity, also goes down. Even if couples want to have a baby after marrying in their 30s, their capacity of reproduction has already declined. It is therefore not easy for them to conceive and thus they rely more on assisted reproductive techniques such as in-vitro fertilization (IVF) in which case the chance of multiple births goes up. In case of multiple-pregnancy, prematurity occurs very frequently and ends in low birthweight.
The third factor is environmental pollution and maternal behavioral changes such as diet, smoking etc., which increase the age-parity specific low birthweight incidence rate. Now we have to separate out how much each factor contributed to the increase in the low birthweight incidence rate. This table is to show the relationship between low birthweight incidence with the maternal age and parity. <Table 1>
<Table 1>
The shaded boxes indicate the age and parity groups that have a lower low birthweight incidence rate than the overall rate of 2.9%. Besides the shaded boxes, the others have a higher low birthweight incidence rate than the overall rate. As you can see, the first baby born to women in their 20s have very low rate and the second baby born to women in their 20s and early 30s have very good outcome. The third baby born to women in their late 20s and early 30s also have good outcome, but the first baby born to women in their early 30s or late 30s has very high chance of low birthweight.
In Korea, between 1995 and 2005 there was a great shift in this maternal age and parity distribution. As you see in <Table 2>, the shaded boxes have a lower low birthweight incidence shown in <Table 1> than the average. But if you see that in 1995 and compared with that in 2005, all these boxes except one had decreased in 2005. On the contrary, the percentage in non-shaded boxes, which indicate a higher low birthweight incidence rate than average, as you see in <Table 1>, went up. Because of these changes we can expect an increase in the total incidence of low birthweight <Table 2>.
I tried to separate out the effect of each factor on the increase of low birthweight incidence. <Figure 6> First it is very obvious that a single birth has a lower chance of low birthweight than multiple births. As I have shown earlier, multiple pregnancies increased between 1995 and 2005. I stratified all births into two groups according to single births and multiple births. Within single births, I try to separate out the effect of maternal age and parity shift on the increase of low birthweight incidence. And I also calculated out the contribution of the age-parity specific incidence rate change on the overall increase of low birthweight incidence. I applied the same process to the multiple pregnancies. From this slide to the following several slides, the process of calculation is explained.
It seems somewhat complicated, but the logic is rather simple. To explain this in detail for you to fully understand would take another 20 minutes, but the key point of my analysis is the formula which I developed based on the very common statistical method, namely direct adjustment, which is used in epidemiological studies. If anyone would like to know how these formulae were developed, and how the result is interpreted, please contact me after the conference for a written explanation. This calculation of the age-parity score yields the exact contribution of the age-parity shift to the increase of low birthweight incidence. From this kind of formula and process, I came up with this result.
Now between 1995 and 2005 there was a 1.26 percent point increase in low birthweight incidence. That is an absolute increase. Among these, about one-half occurred within the single births. And the other half occurred among multiple births. Within the single births, one-half of them were attributed to maternal age and parity distribution change, which actually means an increase of maternal age. The other half was due to the increase of age-parity specific low birthweight incidence rate. The remaining half that occurred in the multiple births was fully due to the increase of maternal age. What this means is that increase of the maternal age contributed mostly to the increase of low birthweight incidence. One quarter of that was due to the age-parity specific incidence rate, which was hard for me to explain.
But fortunately, last year I found two interesting research data that can be correlated with this. One was national health and the nutrition survey data which showed that Korean womenĺs body structure is changing and dividing into two extremes: one group has become very skinny and the other group has become obese, particularly in women in their 20s and early 30s. Both extreme groups, the very skinny group and the obese group, have poor pregnancy outcome. Nowadays, Korean women want to be slim. So they diet inappropriately, and they keep their body weight too low to have good pregnancy outcome. As for the other group, they disregard their diet and become obese. The second study published recently associated air pollution with premature delivery. The extent of its contribution to birthweight incidence is hard to measure, but we know the air pollution in big cities in Korea is a serious problem.
Page Top
III. Countermeasures for increase of low birthweight incidence
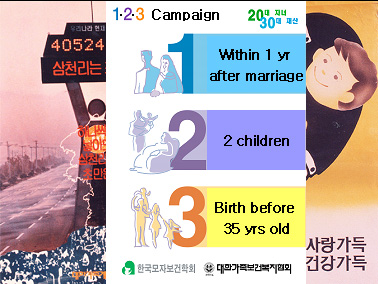
Based on this study result, what can we do about the increasing low birthweight births? First, we have to promote marriage and childbirth at an optimum age of women. For this, we need education and information on the importance of birth at an optimum age. In the past, the Korean government launched a strong family planning campaign saying that Korean peninsula is fully populated with 30 million people, but now is approaching 50 million, so we said, ôTwo is more than enough.üEand then said, ôLetĺs have only one baby.üE But now we say ôWe have to have more babies.üE So we, the Korean Society of Maternal and Child Health which I founded in 1996, proposed launching the üE, 2, 3 MovementüE ôOneüErefers to Ĺwithin 1 year after marriage be pregnantüE ôtwoüEis Ĺhave 2 childrenüE and ôthreeüEis Ĺbefore age 35 of the womanüE Originally, I had said age 30 instead of age 35, but when we proposed this campaign on the website, there was so much criticism from young men and women that we reconsidered and changed it back from 30 to 35. <Figure 7>
The second method for coping with low birthweight births is the policy for single embryo transfer. <Figure 8>
In Korea, this means in-vitro fertilization or IVF which is practiced quite commonly among infertile couples. More than one embryo is transferred to increase the success rate of the IVF, and this therefore results in multiple pregnancies. In 2000, there were more than 10,000 IVF. About 90 % involved multiple embryo transfer. Slightly over 30% resulted in multiple-pregnancies and half of these multiple pregnancies ended in premature birth, which means low birthweight. This indicates that we need to implement a kind of regulation that calls for using only one embryo, as in single embryo transfer in Sweden. Sweden undertook this in 2002 when they had the same problem that we now face. The effect of the regulation in 14 months was as follows. <Figure 9>
The proportion of single embryo transfer went up from 25 % to 73% and the multiple pregnancy rate thus decreased from 23% to 6%, but the clinical pregnancy rate remained stable between 33 to 37 percent.
Then the third method is a neonatal care system for high-risk newborns. No matter what you do, youĺll have a certain number of high-risk newborns, that is, newborns with low birthweight. In Korea we have shortage of intensive care newborn nursery beds to care those high-risk babies. So we need to support hospitals to increase the beds, manpower and high-tech equipment. The last method is appropriate weight control of women. As I mentioned earlier, Korean women diet inappropriately and keep their body weight too low to have a healthy baby. We need to provide them with correct information for dieting.
I hope you have found the message of my presentation interesting and I would be glad to receive some good feedback from you in the audience.
Thank you very much.
Page Top
|