Figure 1
Current concerns on child rearing
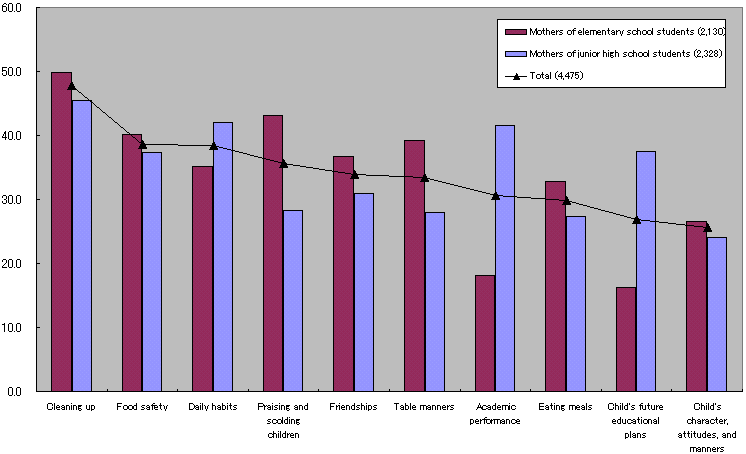
Figure 2
Pressing concerns
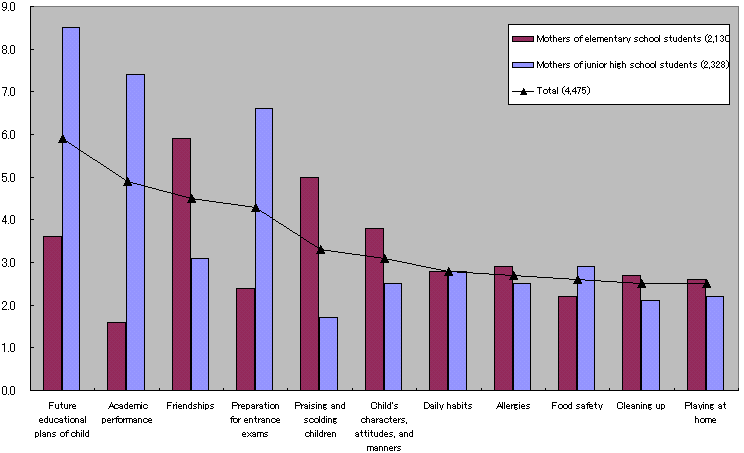
Figure 3
The information source that mothers find most reliable X school grade
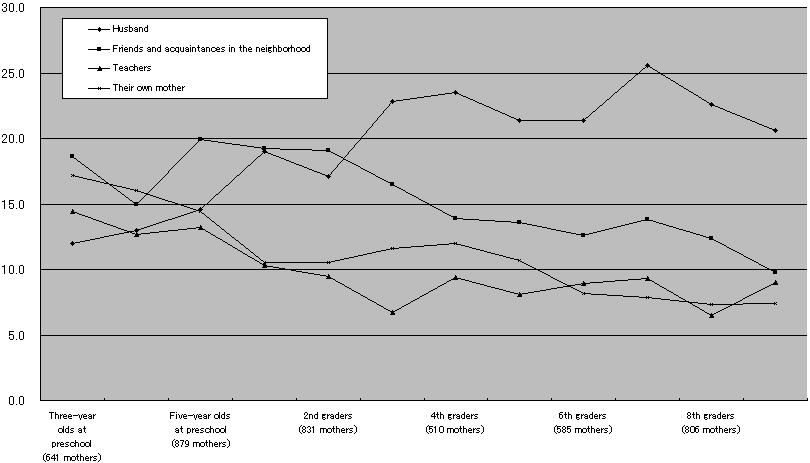
Figure 4
Mother's frequent interactions with children and their emotional state X the degree of enjoyment
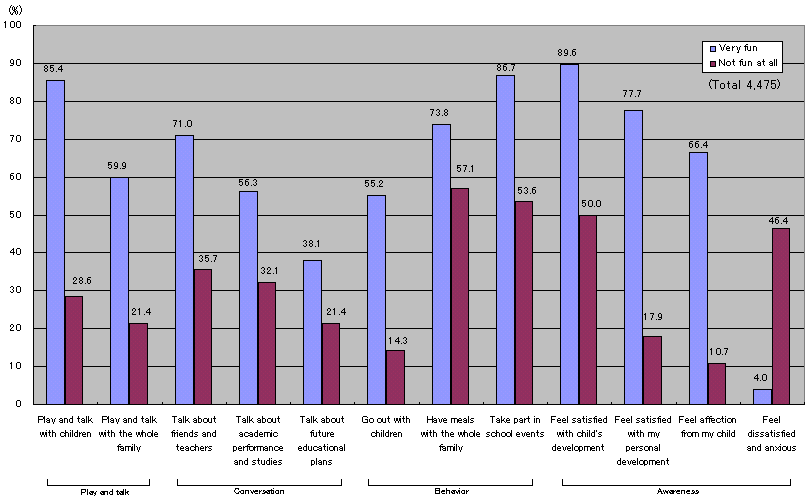
Figure 5
Behaviors in which mothers wish for their children to improve X gender
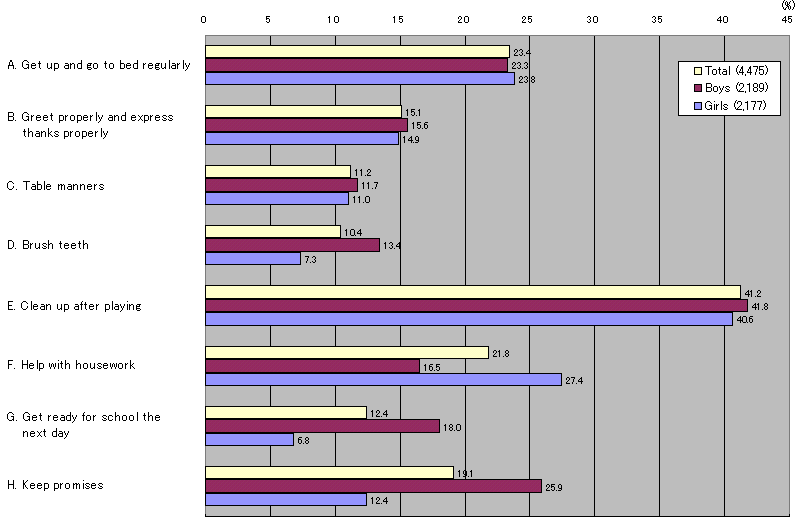
Figure 6
Behaviors that should be learned at home and at school X gender
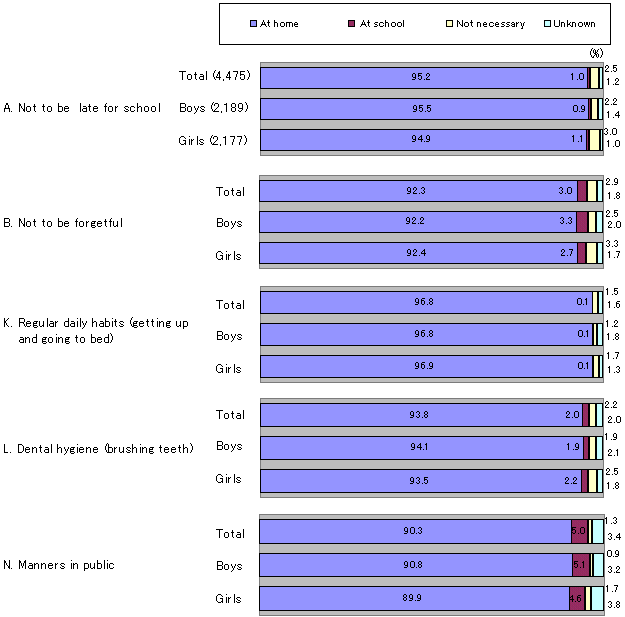
Figure 7
Parents' key socialization issues at home
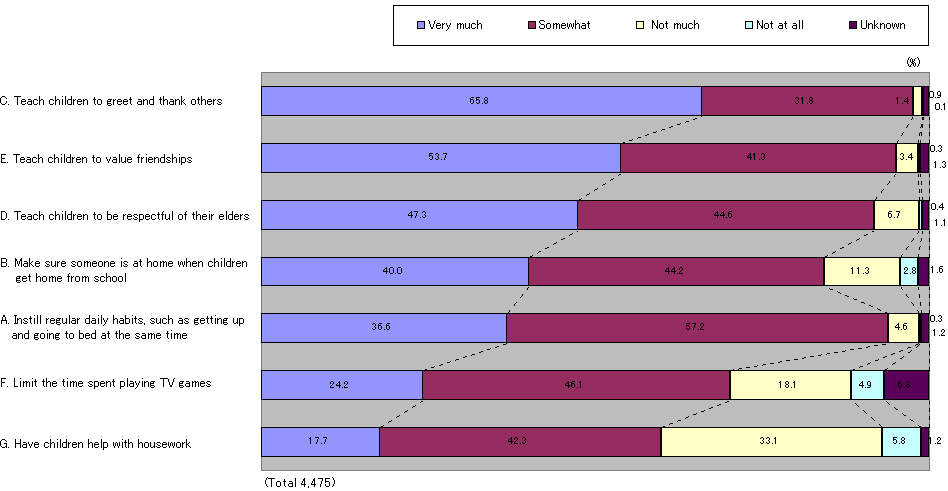
Figure 8
Parents' educational policy X grade
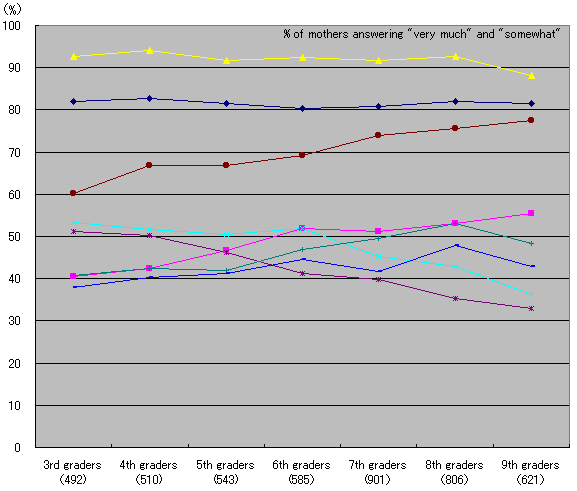
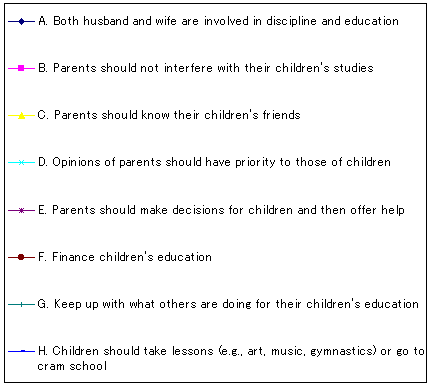
Figure 9
Percentage of children going to cram schools or taking lessons (e.g., art, music, gymnastics) X grade
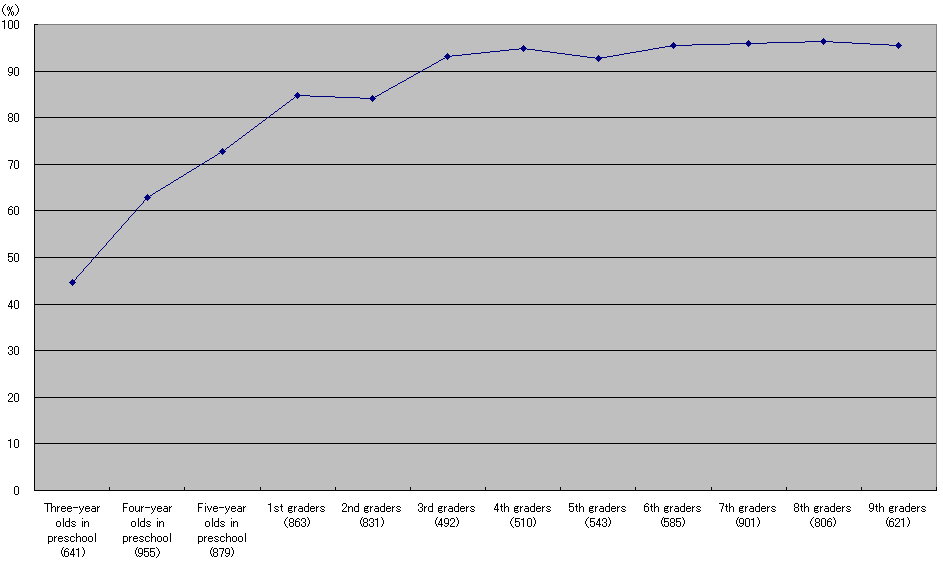
Figure 10
10. Greatest benefit of cram schools or lessons
(e. g. art, music, grmnastics, etc.) X gender
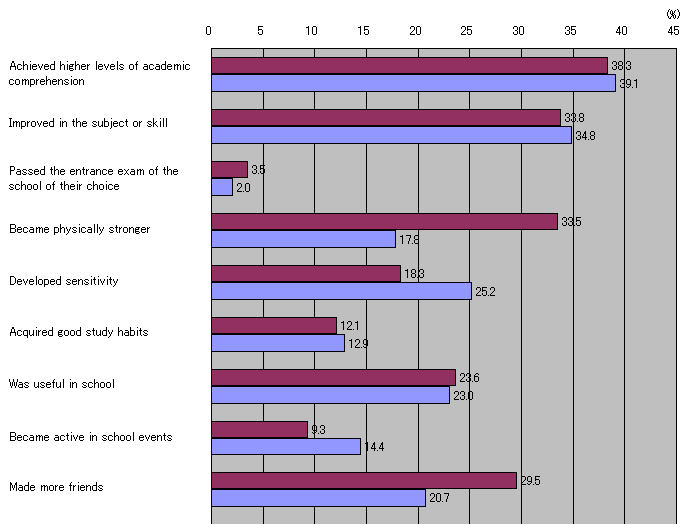
Figure 11
Highest level of education that parents expect of their children to complete X gender
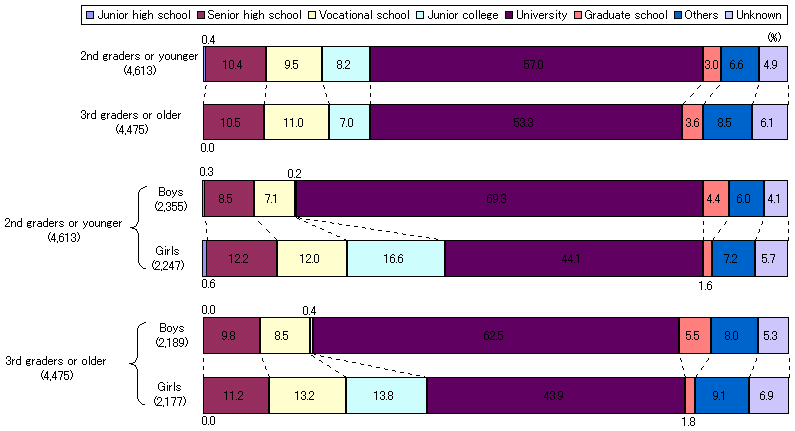
Figure 12
Gender of children

Figure 13
Birth order of children

Figure 14
Grade

Figure 15
Type of schools
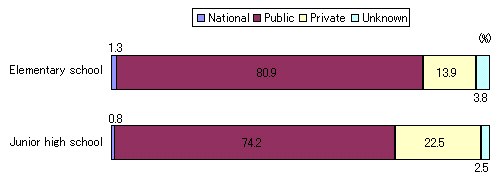
Figure 16
Type of schools X grade
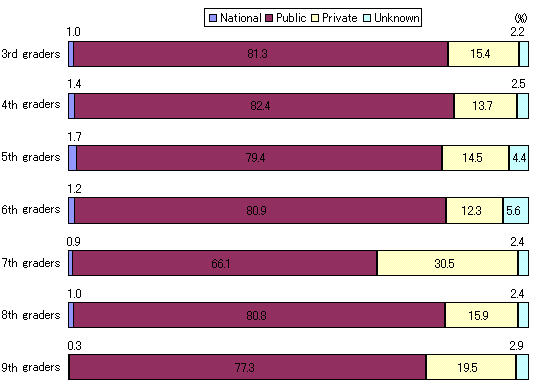
Figure 17
Ages of fathers and mothers
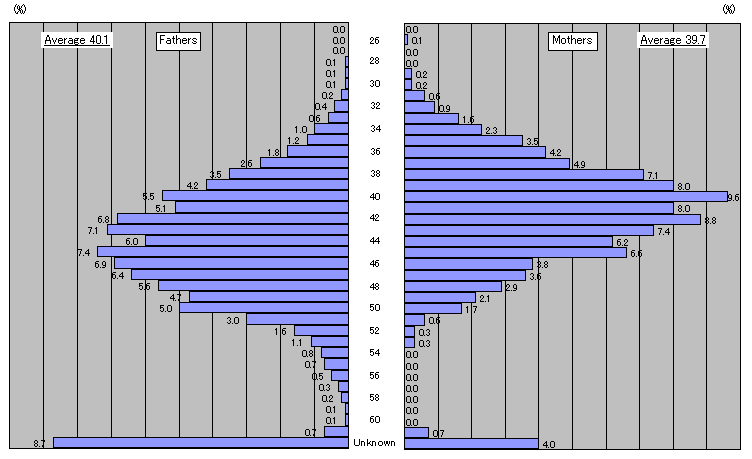
Figure 18
Fathers' occupation

Figure 19
Mothers' working status

Figure 20
Mothers' occupation

Figure 21
Residence

Figure 22
Number of years of residence

Figure 23
Type of housing
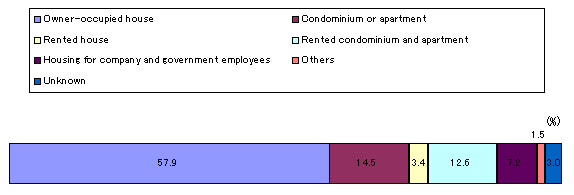
Figure 24
Family composition

Figure 25
Number of family members

Figure 26
Financial situation of the household

Figure 27
Information sources for child rearing and education
Figure 28
Information sources for child rearing and education X grade
Figure 29
Daily behavior
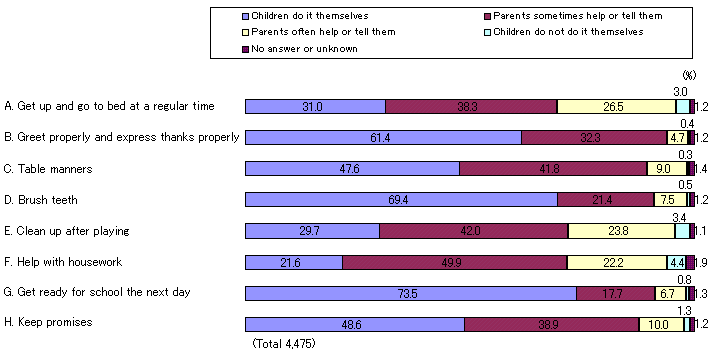
Figure 30
Daily behavior (done without parental help) X gender
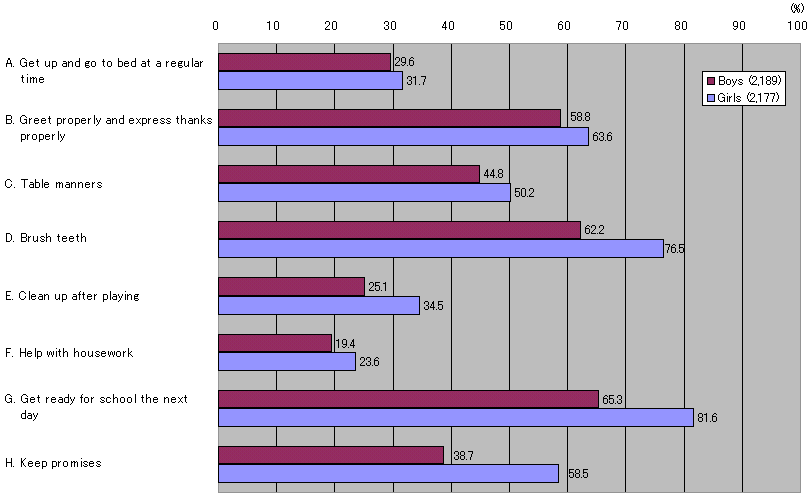
Figure 31
Areas mothers would like their children to improve X grade
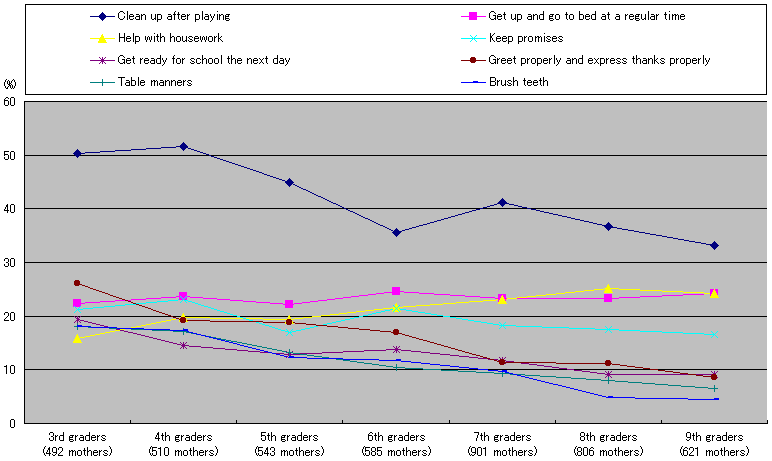
Figure 32
Satisfaction with children's daily behavior and independence X gender
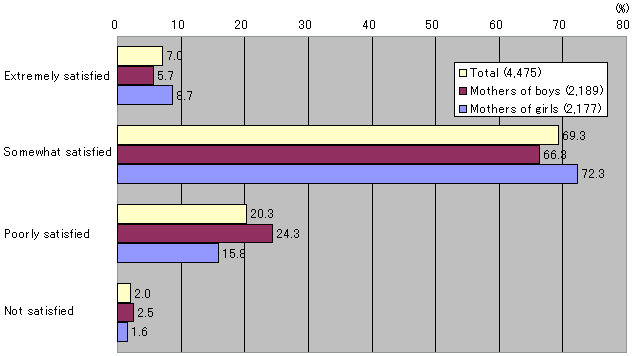
Figure 33
Satisfaction with children's daily behavior and independence X birth order

Figure 34
Overall satisfaction with child rearing

Figure 35
Satisfaction with present child rearing X grade
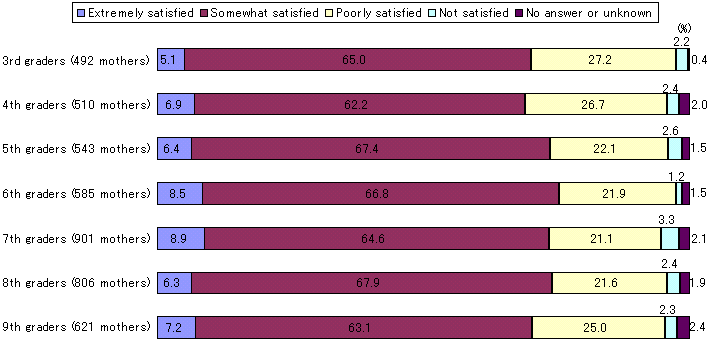
Figure 36
Satisfaction with present child rearing X gender X grade
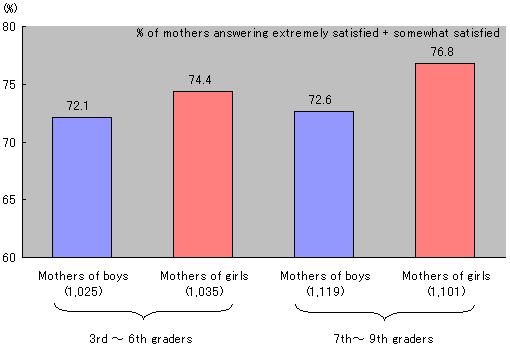
Figure 37
Satisfaction with present child rearing X mothers' working status

Figure 38
How mothers view academic performance X gender X grade
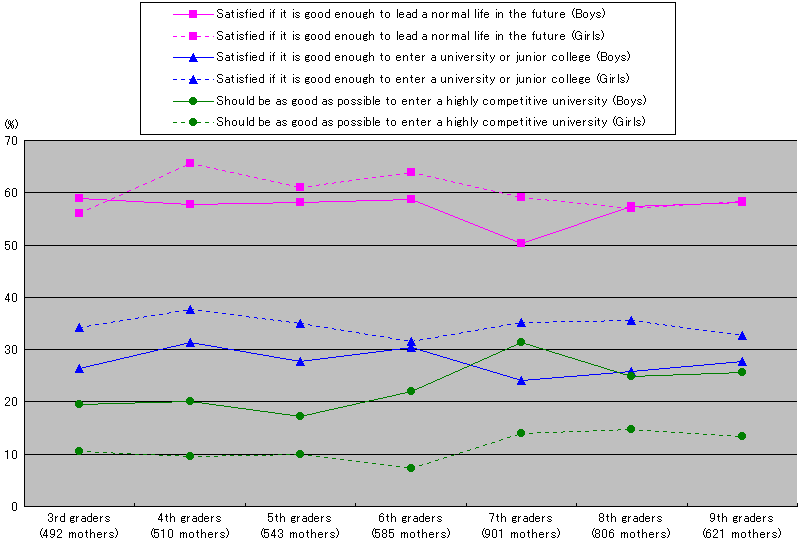
Figure 39
How mothers view studying X gender X grade
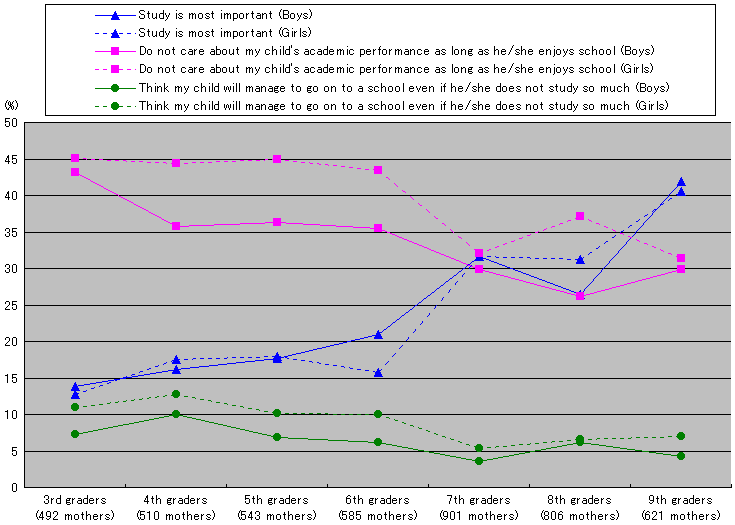
Figure 40
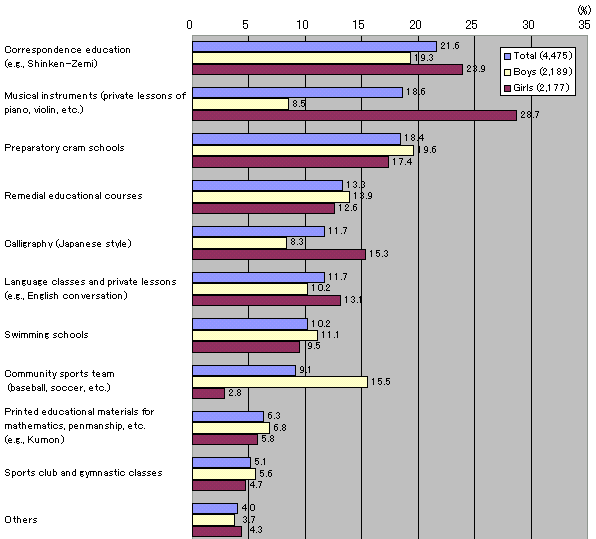
Cram schools and after-school lessons
Current concerns on child rearing

Figure 2
Pressing concerns

Figure 3
The information source that mothers find most reliable X school grade

Figure 4
Mother's frequent interactions with children and their emotional state X the degree of enjoyment

Figure 5
Behaviors in which mothers wish for their children to improve X gender

Figure 6
Behaviors that should be learned at home and at school X gender

Figure 7
Parents' key socialization issues at home

Figure 8
Parents' educational policy X grade


Figure 9
Percentage of children going to cram schools or taking lessons (e.g., art, music, gymnastics) X grade

Figure 10
10. Greatest benefit of cram schools or lessons
(e. g. art, music, grmnastics, etc.) X gender

Figure 11
Highest level of education that parents expect of their children to complete X gender

Figure 12
Gender of children

Figure 13
Birth order of children

Figure 14
Grade

Figure 15
Type of schools

Figure 16
Type of schools X grade

Figure 17
Ages of fathers and mothers

Figure 18
Fathers' occupation

Figure 19
Mothers' working status

Figure 20
Mothers' occupation

Figure 21
Residence

Figure 22
Number of years of residence

Figure 23
Type of housing

Figure 24
Family composition

Figure 25
Number of family members

Figure 26
Financial situation of the household

Figure 27
Information sources for child rearing and education
| % | |||
| Friends and acquaintances in the neighborhood | 63.2 | 59.1 | 61.1 |
|---|---|---|---|
| Husband | 47.9 | 48.4 | 48.3 |
| School teachers | 46.6 | 42.7 | 44.6 |
| Newspapers | 39.3 | 47.5 | 43.6 |
| Their own mother | 38.6 | 29.1 | 33.6 |
| Friends and acquaintances not in the neighborhood | 28.1 | 32.1 | 30.1 |
| Their children | 22.9 | 27.4 | 25.3 |
| Family members and relatives other than mother or mother-in-law | 24.7 | 22.5 | 23.5 |
| Cram school teachers and tutors | 11.0 | 17.4 | 14.2 |
| Mother-in-law | 14.8 | 11.4 | 13.0 |
Figure 28
Information sources for child rearing and education X grade
| % | ||||||
| Friends and acquaintances in the neighborhood | Husband | Teachers | Newspapers | Their own mother | Their children | |
|---|---|---|---|---|---|---|
| Three-year olds in preschool (641 mothers) | 71.9 | 39.0 | 59.4 | 31.2 | 53.0 | 13.1 |
| Four-year olds in preschool (955 mothers) | 72.1 | 40.2 | 52.4 | 35.2 | 51.4 | 12.7 |
| Five-year olds in preschool (879 mothers) | 72.2 | 42.4 | 54.9 | 35.6 | 51.5 | 14.9 |
| 1st graders (863 mothers) | 74.6 | 43.9 | 47.4 | 41.5 | 40.7 | 18.4 |
| 2nd graders (831 mothers) | 72.7 | 42.6 | 50.5 | 42.7 | 42.0 | 17.6 |
| 3rd graders (492 mothers) | 64.4 | 48.2 | 45.3 | 36.4 | 41.1 | 19.7 |
| 4th graders (510 mothers) | 64.3 | 49.6 | 50.6 | 40.0 | 45.9 | 23.1 |
| 5th graders (543 mothers) | 63.5 | 49.7 | 47.5 | 41.3 | 35.2 | 23.9 |
| 6th graders (585 mothers) | 60.5 | 44.1 | 42.9 | 39.7 | 32.1 | 24.6 |
| 7th graders (901 mothers) | 59.3 | 52.2 | 44.8 | 46.2 | 31.2 | 28.1 |
| 8th graders (806 mothers) | 61.2 | 48.5 | 40.4 | 48.9 | 28.8 | 27.8 |
| 9th graders (621 mothers) | 57.0 | 44.6 | 42.7 | 47.5 | 27.4 | 26.2 |
Figure 29
Daily behavior

Figure 30
Daily behavior (done without parental help) X gender

Figure 31
Areas mothers would like their children to improve X grade

Figure 32
Satisfaction with children's daily behavior and independence X gender

Figure 33
Satisfaction with children's daily behavior and independence X birth order

Figure 34
Overall satisfaction with child rearing

Figure 35
Satisfaction with present child rearing X grade

Figure 36
Satisfaction with present child rearing X gender X grade

Figure 37
Satisfaction with present child rearing X mothers' working status

Figure 38
How mothers view academic performance X gender X grade

Figure 39
How mothers view studying X gender X grade

Figure 40
Cram schools and after-school lessons
